2024-2025 Global Crypto Enforcement Statistics: Data & Trends

Regulators finally have the numbers to prove crypto isn't just a wild west anymore. Between 2024 and early 2025, global crypto enforcement shifted from vague warnings to hard data, revealing a complex picture where fraud is dropping in some areas while new theft vectors emerge in others. If you are tracking digital asset risks or regulatory compliance, understanding these specific metrics is crucial for navigating the current landscape.
The core tension right now lies in how we measure "crime." Two major firms, TRM Labs and Chainalysis, released reports in early 2025 with vastly different headlines. This isn't just a disagreement; it reflects a fundamental split in methodology that affects how governments allocate resources. Here is what the actual data says about the state of play.
The Discrepancy in Crime Metrics
When TRM Labs published its 2025 Crypto Crime Report in January, it highlighted a positive trend: illicit crypto activity linked specifically to fraud dropped by 40% in 2024 compared to the previous year. They calculated that at least USD 10.7 billion was sent to fraud addresses. For context, this continues a downward trajectory from the peak in 2022.
However, Chainalysis told a different story just weeks later in February. Their report stated that USD 40.9 billion was received by illicit cryptocurrency addresses in 2024. Why such a huge gap? It comes down to scope. TRM focused narrowly on fraud-related flows, while Chainalysis used a broader definition including darknet markets, ransomware payments, and scams. Furthermore, Chainalysis notes that their figures usually rise by about 25% as more addresses are identified over time. In fact, their 2023 figure initially stood at $24.2 billion but grew to $46.1 billion within a year as data matured.
This methodological difference matters because it changes the narrative. Is the industry getting safer, or are criminals just moving to harder-to-track channels? The answer is likely both. While simple phishing scams may be declining due to better user education, sophisticated attacks persist. Kroll’s Cyber Threat Intelligence team documented that nearly $1.93 billion was stolen in crypto-related crimes during the first half of 2025 alone. This suggests that while overall fraud volume might be cooling, the severity of individual incidents remains high.
Where the Money Moves: Blockchain Distribution
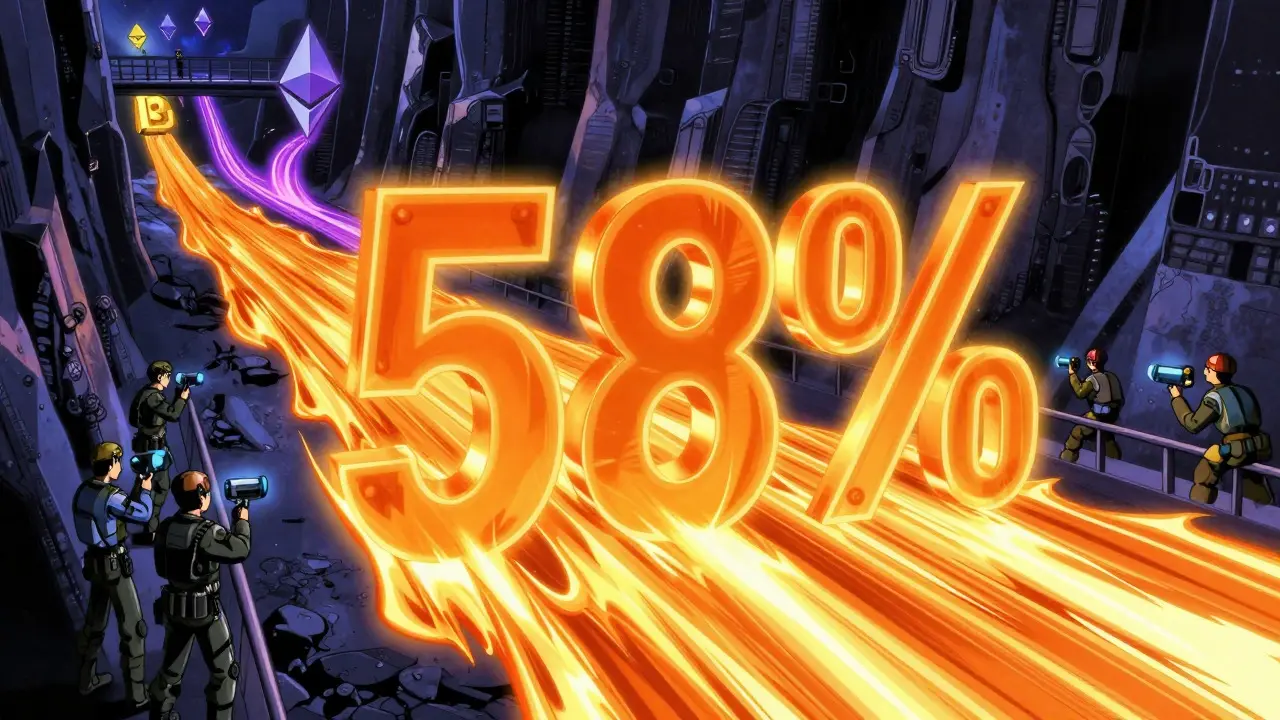
Not all blockchains carry equal risk. TRM Labs’ analysis provides a clear breakdown of where illicit volume concentrates. In 2024, the TRON network hosted 58% of global illicit crypto volume. Ethereum followed with 24%, and Bitcoin accounted for 12%. Smaller networks like Binance Smart Chain and Polygon each held about 3%.
| Blockchain | Share of Illicit Volume | Key Driver |
|---|---|---|
| TRON | 58% | Low fees, USDT stability |
| Ethereum | 24% | Smart contract complexity |
| Bitcoin | 12% | Legacy value storage |
| Binance Smart Chain | 3% | Cross-chain bridges |
| Polygon | 3% | DeFi integration |
The dominance of TRON is notable because it experienced the most dramatic change. Its illicit volume dropped by USD 6 billion, effectively halving its proportion of total activity. This shift wasn't accidental. It resulted from the formation of the T3 Financial Crime Unit (T3 FCU) in August 2024. This collaborative initiative between TRON, Tether, and TRM Labs facilitated the freezing of over USD 130 million in illicit proceeds through direct law enforcement partnerships. Of the illicit volume on TRON, 49% was linked to sanctioned entities, and 32% involved blocklisted funds. Approximately 20% of blocklisted USDT was even reissued to victims and government accounts. This case study proves that targeted public-private partnerships can disrupt illicit flows significantly when technical capabilities align with legal authority.
Global Regulatory Compliance Gaps
While criminal tactics evolve, regulatory frameworks struggle to keep pace. TRM Labs’ Global Crypto Policy Review & Outlook 2024/2025 analyzed 24 jurisdictions representing roughly 70% of global crypto exposure. They found that over 60% of these regions introduced new crypto-related policies during 2024. However, having a policy on paper is different from enforcing it in practice.
The Financial Action Task Force (FATF) provides the global benchmark here. In March 2024, they assessed 58 jurisdictions. The data showed that 91% had either enacted or were implementing an Anti-Money Laundering (AML) registration regime, and 84% had implemented the Travel Rule. Yet, subsequent reviews revealed significant implementation gaps. A PwC Global Crypto Regulation Report from January 2025 corroborated this, stating that 75% of surveyed jurisdictions remained only partially compliant or non-compliant with FATF requirements. Nearly 30% still failed to implement the Travel Rule, which is critical for tracking cross-border transactions.
This disconnect creates a "compliance shadow zone." Regulators think they are covered because laws exist, but without effective data sharing and technical monitoring, enforcement remains weak. The result is a fragmented global landscape where a transaction might be fully traceable in one country but invisible in another, depending on local infrastructure maturity.

Penalty Patterns: Crypto vs. Traditional Finance
How does crypto enforcement compare to traditional banking fines? The Coincub Crypto Asset Risk Report 2025 offers a stark comparison. Between 2020 and early 2025, the crypto industry faced aggregate penalties totaling $13.5 billion across formal sanctions, fines, and security incidents. In contrast, traditional financial institutions like Bank of America and JPMorgan Chase have collectively faced penalties exceeding $97 billion, with the broader sector incurring over $300 billion in fines for mortgage abuses and sanctions breaches.
Despite the lower monetary totals, the pattern in crypto is distinct. Regulatory bodies are focusing more on establishing compliance frameworks than punishing systemic fraud. In fact, 72% of crypto enforcement records involve regulatory compliance actions rather than outright criminal fraud convictions. This suggests that agencies are still in the "rule-setting" phase, using fines to force adoption of standards rather than to punish deep-rooted corruption. A prime example is the U.S. Department of Justice’s action in October 2024, where the District of Massachusetts charged 17 individuals with market manipulation through bots and wash trading of alt and meme coins. This targets behavior rather than just missing paperwork.
Outlook for 2025 and Beyond
Looking ahead, the enforcement landscape is maturing. The user base is expanding rapidly, estimated at 560-659 million globally in 2024 and projected to surpass 950 million by the end of 2025. More users mean more potential targets for criminals, but also more data points for investigators.
Future trends point toward three key areas:
- Stablecoin Oversight: With 68% of regulatory bodies planning specific guidance for stablecoins by Q3 2025, this segment will face tighter scrutiny.
- Cross-Border Cooperation: International enforcement cooperation is expected to improve, potentially enhancing asset recovery mechanisms that currently fail in many cases.
- Specialized Units: The success of the T3 FCU model suggests more industries will form similar units, combining tech firms, issuers, and analytics providers to fight crime proactively.





Comments
Ian Munro
August 30, 2026 AT 05:58TRON holding 58% of illicit volume is the headline here. The low fees and USDT stability make it a magnet for moving money quickly without friction.
Steve Sulley
August 30, 2026 AT 06:40yeah but its not like tron is doing anything wrong they just have better tech than eth which is slow and expensive so why would criminals use that when they can use tron? also the whole 'illicit' label is just regulators trying to control the narrative because they dont understand how blockchain works in the first place
Ian Munro
August 31, 2026 AT 17:28Fair point on the tech, but the T3 FCU freezing $130M suggests the infrastructure is now being used for enforcement too, not just evasion.
Laine Van Sickle
September 1, 2026 AT 09:16i mean who even reads these reports honestly? i just see big numbers and think "oh cool" then forget about it by lunch. its all so complicated with all the different chains and rules. feels like we are always one scam away from losing everything anyway. at least the fraud went down right? that has to count for something right? :)
Trista Dennis
September 3, 2026 AT 05:25Ah, the classic "fraud is down" defense. Sure, phishing scams are down, but we're still seeing billions vanish into thin air via rug pulls and bridge hacks. It's not about the number of victims, it's about the size of the hole. And don't get me started on the Travel Rule; half the world still thinks it's optional reading material.
nic c
September 4, 2026 AT 03:24Oh, you want to talk about the real mess? Let’s dive into the absolute circus that is the regulatory landscape, shall we? Because if you think the TRON dominance is wild, wait until you see how the US DOJ is playing whack-a-mole with meme coin wash trading. It’s like watching a toddler try to assemble IKEA furniture while the house is on fire. We’re talking about seventeen individuals charged in Massachusetts for bot manipulation, which sounds like a joke until you realize the sheer audacity required to pull off such a scheme in broad daylight. And let’s not forget the stablecoin oversight coming down the pipe; sixty-eight percent of regulators planning specific guidance by Q3 2025? That’s not progress, that’s panic. They’re scrambling to catch up to a technology that moves faster than their memos can be typed. It’s a glorious, chaotic spectacle of incompetence meeting innovation, and frankly, I’m loving every second of the confusion.
Alan Hawkins
September 4, 2026 AT 20:18Good breakdown of the DOJ charges. It does seem like the focus is shifting from just paperwork compliance to actual behavioral enforcement, which is a necessary step.
Linda Jevne
September 6, 2026 AT 08:46There is a profound irony in how we measure 'crime' in a decentralized space. We rely on centralized firms like Chainalysis and TRM to define the boundaries of legality, yet we complain about centralization. It is a paradox of our digital age: seeking freedom from institutions while depending on them to police our freedoms. The discrepancy between their reports isn't just methodological; it's philosophical. One sees a shrinking shadow, the other sees a growing beast. Which lens do we choose? Perhaps the truth lies in the uncomfortable middle, where data is both illuminating and obscuring simultaneously.
Bill Patterson
September 7, 2026 AT 23:11too much fluff. bottom line is regulation is catching up. thats it. move on
Rachel Etheridge
September 9, 2026 AT 14:49OMG did anyone else notice the part about the user base exploding to 950 million?! its insane! i feel like we are all just waiting for the next big hack to happen to us personally lol. its scary but also exciting? idk. just hope my wallet stays safe. this industry needs to grow up fast before everyone gets burned again :(
Matt Reckdenwald
September 11, 2026 AT 10:50The growth is undeniably rapid, and with it comes a delicate balance. As the ecosystem expands, the safety net must widen equally. It is a testament to human resilience that we continue to innovate despite the risks. The fear is natural, but so is the opportunity. We are building something unprecedented, and the turbulence is merely the cost of entry into a new era of financial autonomy. Let us hope the architects of this future prioritize security as much as speed.
Emmanuel Ogbomo
September 12, 2026 AT 06:12Interesting perspective on the global distribution. From an African standpoint, the lack of local enforcement infrastructure makes cross-border issues even more complex. The T3 model could be very relevant for regions with high mobile money adoption but weak banking ties.
Jillian Pye
September 13, 2026 AT 09:12:) It is fascinating how the definition of 'illicit' changes based on who is counting. A quiet observation on the methodology gap: it highlights that we are still in the early days of standardizing digital asset forensics. The data is there, but the consensus on interpretation remains elusive. Perhaps that is the true challenge ahead, not just the code, but the common language.
Melanie Armijo
September 14, 2026 AT 00:01It really makes you think about how we trust systems, doesn't it? Whether it's a bank or a blockchain, we're just betting on the integrity of the people behind the curtain. The fact that we're seeing more transparency now is a good sign, even if the numbers are confusing. We're learning to walk, basically. Keep going!